EMA/SMA Crossovers
EMA (Exponential Moving Average) and SMA (Simple Moving Average) crossovers are essential concepts in technical analysis. SMA calculates the average price of an asset over a specified period, providing a smoothed trend line. In SMA crossovers, short-term SMA crossing above long-term SMA indicates a bullish trend, while crossing below suggests a bearish trend. EMA, on the other hand, gives more weight to recent prices, making it more responsive to recent market movements. EMA crossovers occur when short-term EMA crosses above long-term EMA, signaling potential upward movement, or when it crosses below, indicating potential downward movement. Traders use these crossovers to identify buying or selling opportunities in financial markets.
Benefits of Moving Average Crossovers:

Trend identification
A trader may use a shorter-term moving average and a longer term moving average to identify when the short-term trend is crossing above or below the long-term trend. This can help the trader determine when to enter or exit a trade.

Reversal signals
If a short-term moving average crosses below a longer-term moving average, it may indicate a potential downtrend, while if the short-term moving average crosses above the long-term moving average, it may indicate a potential uptrend

Price support and resistance
Moving averages can be used to identify support and resistance. A popular MA is the 200-day, but other timeframes can also be used. When a stock price is above its MA, it is considered to be in a bullish trend. When a stock price is below its MA, it is considered to be in a bearish trend.
Popular Combinations
Period: The period can be 1 day, 1 hour, 1 minute, or any other timeframe. The descriptions hold true no matter if you use shorter periods for day trading or longer periods for swing trading.
5-period EMA and 20-period EMA
This is a popular combination of EMAs used to identify short-term trends and potential entry and exit points for trades. The 5- period EMA is often used to identify short-term trends and potential entry points, while the 20-period EMA is used to provide a broader view of the market and identify longer-term trends.
50-period EMA and 200-period EMA
This is a popular combination of EMAs used to identify long-term trends in the market. When the 50-period EMA crosses above the 200-period EMA, it may indicate a potential uptrend, while when the 50-period EMA crosses below the 200-period EMA, it may indicate a potential downtrend.
10-period EMA and 30-period EMA
This is another popular combination of EMAs used to identify short-term and medium-term trends in the market. The 10-period EMA is often used to identify short-term trends and potential entry points, while Design Response 2 6 the 30-period EMA is used to provide a broader view of the market and identify medium-term trends.
5-period EMA and 20-period SMA
Used to identify short-term trends and potential entry and exit points for trades. The EMA5 is a fast-moving average that is more responsive to short-term changes in the market, while the SMA20 is a slower-moving average that provides a broader view of the market and helps to smooth out price fluctuations.
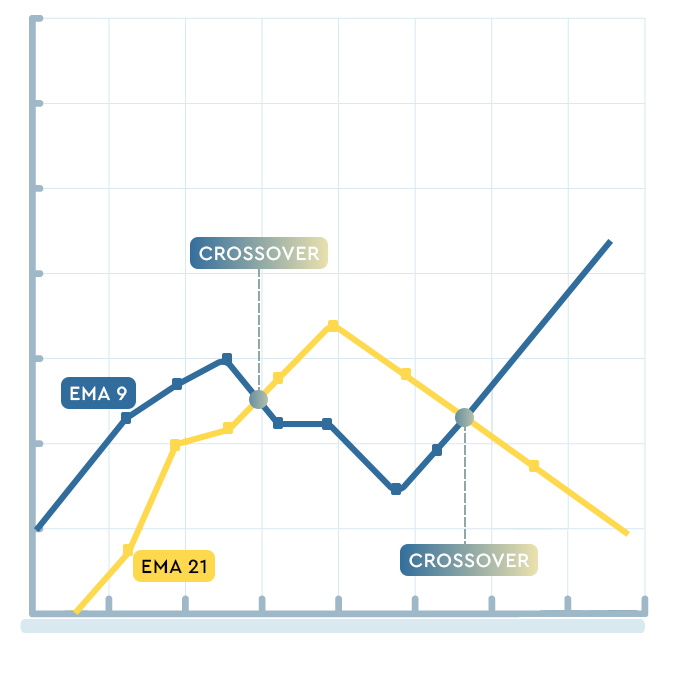
9-period EMA and 21-period EMA
The 9-period EMA is often used to identify short-term trends and potential entry points for trades, while the 21-period EMA is used to identify longer-term trends and provide a more comprehensive view of the market.
50-period SMA and 200-period SMA
When the 50-period SMA crosses above the 200- period SMA, it may indicate a potential long-term uptrend, while when the 50-period SMA crosses below the 200-period SMA, it may indicate a potential long-term downtrend
20-period SMA and 50-period SMA
Used to identify medium-term trends and potential entry and exit points for trades. The 20-period SMA is often used to identify short-term trends, while the 50-period SMA provides a broader view of the market and helps to smooth out price fluctuations.
10-period SMA and 30-period SMA
Used to identify short-term and medium-term trends in the market. The 10-period SMA is often used to identify short-term trends and potential entry points, while the 30-period SMA provides a broader view of the market and identifies medium-term trends.

Financial Python: Where Innovation and Investment Converge. Empowering you with Python-driven tools and expert analysis for confident financial decision-making. Explore our platform and embark on your investment journey today.


