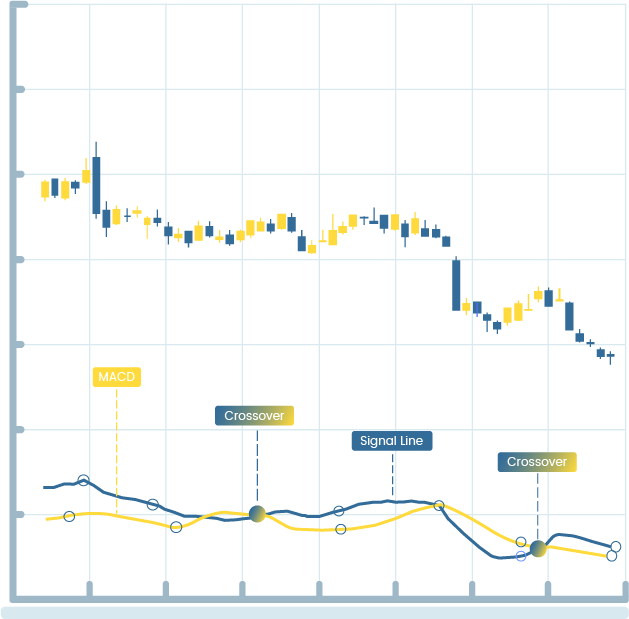
MACD Signal
MACD (Moving Average Convergence Divergence):
MACD is a versatile technical indicator used by traders to identify potential trend reversals, momentum shifts, and trading opportunities. It's based on the convergence and divergence of two exponential moving averages (EMAs) and a signal line.
Benefits and Uses:
1. Trend Reversal Signals: MACD generates signals when the MACD line crosses above (bullish) or below (bearish) the signal line. These crossovers can indicate potential trend reversals, helping traders spot entry and exit points.
2. Momentum Confirmation: MACD histograms represent the difference between the MACD line and the signal line. Increasing histogram bars indicate growing momentum in the direction of the MACD line, confirming price trends.
3. Divergence Detection: MACD can identify divergence between price and the MACD histogram, which may signal a potential trend reversal. Bullish divergence occurs when prices make lower lows while the MACD makes higher lows, and vice versa for bearish divergence.
4. Overbought and Oversold Conditions: MACD can be used to identify overbought (above zero) and oversold (below zero) conditions. Extreme values may suggest a price correction is imminent.
Popular Timeframes:
1-Hour MACD:
Benefit: Shorter timeframes like the 1-hour MACD provide traders with timely signals for day trading and intraday strategies. It's ideal for traders seeking quick decisions based on short-term trends.
1-Day MACD:
Benefit: Daily MACD is favored by swing traders and those with a slightly longer time horizon. It helps identify medium-term trends and provides valuable signals for position trading.
Weekly MACD:
Benefit: Weekly MACD is suitable for traders and investors with a more extended outlook. It captures longer-term trends and can aid in identifying major trend shifts.
Monthly MACD:
Benefit: Monthly MACD is ideal for investors and traders focused on the big picture. It helps identify long-term trends and potential investment opportunities.

Financial Python: Where Innovation and Investment Converge. Empowering you with Python-driven tools and expert analysis for confident financial decision-making. Explore our platform and embark on your investment journey today.


