RSI (Relative Strength Index)
RSI is a momentum oscillator that measures the speed and change of price movements. It's a popular technical indicator used by traders and investors to identify overbought and oversold conditions in a market.
What is RSI?
The Relative Strength Index (RSI) is a numerical value that ranges from 0 to 100. It's calculated using the average of gains and losses over a specified period, often 14 periods, and is used to gauge the strength of price movements. RSI is classified as a momentum oscillator because it quantifies the velocity and magnitude of recent price changes.
How is RSI Used?
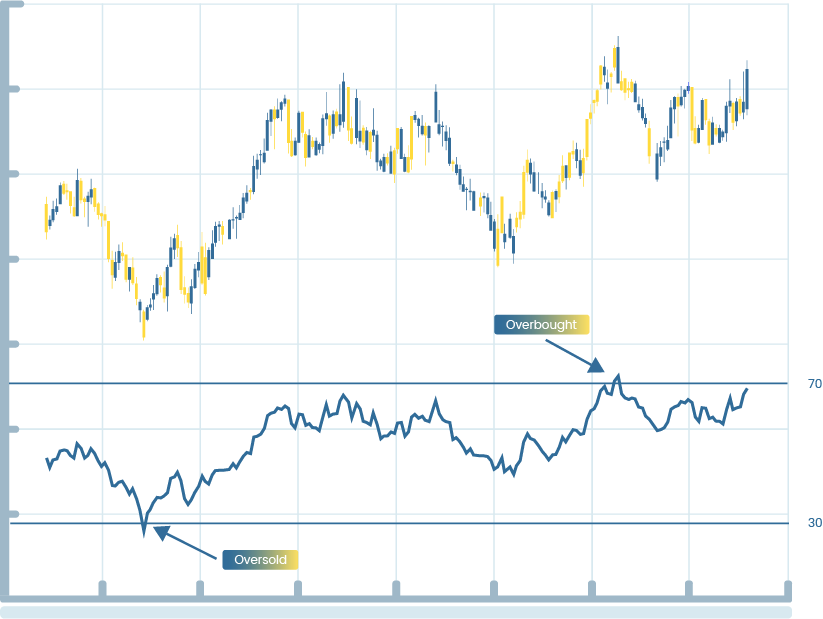
1. Overbought and Oversold Conditions:
RSI values above 70 are typically considered overbought, indicating that the asset's price may be due for a correction or reversal. Conversely, RSI values below 30 are often seen as oversold, suggesting a potential buying opportunity.
2. Trend Confirmation:
RSI can be used to confirm the strength of a trend. When RSI moves in the same direction as the price trend, it suggests that the trend is strong and likely to continue. Divergence between RSI and price may signal a weakening trend.
3. Divergence Detection:
RSI divergence occurs when the indicator's direction differs from the price movement. Bullish divergence happens when RSI makes higher lows while prices make lower lows, indicating a potential bullish reversal. Bearish divergence is the opposite.
3. Support and Resistance:
Traders often use RSI to identify potential support and resistance levels. If RSI consistently finds support at a specific level, it can indicate the strength of that support zone.
Popular Timeframes:
1. 1-Hour RSI:
-
Benefit: Shorter timeframes like the 1-hour RSI provide timely signals for day traders and intraday strategies, helping identify short-term trend changes.
2. 1-Day RSI:
-
Benefit:The 1-day RSI is suitable for swing traders and those looking at medium-term trends. It provides signals for position trading and investing decisions.
3. Weekly RSI:
-
Benefit: Weekly RSI is preferred by traders and investors focusing on longer-term trends. It helps identify major trend shifts and investment opportunities.

Financial Python: Where Innovation and Investment Converge. Empowering you with Python-driven tools and expert analysis for confident financial decision-making. Explore our platform and embark on your investment journey today.


